
A Data Analytics Project
DIVVY Bikes
Project Overview
The problem
Analysis to help answer the key question: “In what ways do members and casual riders use Divvy bikes differently ?”
The goal
Perform the Analysis to answer the above question.
The product
Divvy, a Chicago Department of Transportation program, is a bike-share system in Chicago and Evanston. Divvy is a convenient, fun, and affordable transportation option for commuting to work, getting around town, and exploring Chicago. Like other bike-share systems, Divvy consists of a fleet of specially designed, geotracked, and durable bikes that are locked into a network of docking stations throughout the region. The bikes can be unlocked from one station and returned to any other station in the system 24/7.
My role
Data Analyst responsible for conducting the Analysis.
Responsibilities
Report the steps of the Data Analysis process that i followed while creating this case study.
Ask; Prepare; Process; Analyse; Share & Act.
Project duration
October 2019 to February 2020.
ASK:
Summary
Lindsay Silk-Kremenak, Director of Marketing for the Chicago area’s Divvy bike-share program, understood the company’s future success depended on a focused approach to marketing that maximized the number of annual memberships. She was sure that data analysis could unlock the insights needed to design marketing strategies that would help her achieve that objective.
Consumers can buy access to Divvy bikes using these options: (1) Single-ride passes for $3 per 30-minute trip; (2) Full-day passes for $15 per day for unlimited three-hour rides in a 24-hour period; and (3) Annual memberships for $99 per year for unlimited 45-minute rides. Small charges (15 cents per minute) are incurred when single rides exceed the maximum time allowance to dissuade consumers from checking out bikes and not returning them on time.
Silk-Kremenak turned to her team of data analysts for help. With her objective of converting casual riders to members, she worked with her team to design three questions which, once answered, could provide guidance for the marketing program she needed:
-
What ways do members and casual riders use Divvy bikes differently?
-
Why would Casual Riders want use Divvy more?
-
How can Divvy influence Casual Riders to become Members?
Key Characters
Divvy:
A Chicago-based bike-share program that features nearly 6,000 bicycles and more than 600 docking stations.
Lindsay Silk-Kremenak:
Director of Marketing for Divvy, responsible for the development of campaigns and initiatives to promote the Divvy program using email, organic social, paid media, Out Of Home (OOH), and other media channels.
Divvy marketing analyst team:
Team of data analysts that reports to Lindsay Silk-Kremenak and is responsible for the collection, analysis, and reporting of data that help guides Divvy marketing and other initiatives.
Divvy executive team:
Notoriously detail-oriented executive team that provides approval for marketing campaigns, initiatives, and programs Silk-Kremenak recommends.
The Question Assigned To Me:
What ways do members and casual riders use Divvy bikes differently?
PREPARE:
● Where is your data located? - https://divvy-tripdata.s3.amazonaws.com/index.html
● How is the data organised? - Data is organised into zipped CSV files
● Are there issues with bias or credibility in this data? Does your data ROCCC? - No the datasets are credible supplied by Motivate International inc.
● How are you addressing licensing, privacy, security, and accessibility? - The data made available by Motivate International Inc. under this license.)
● How did you verify the data’s integrity? - Opened the last 4 quarters CSV files in Excel for brief check that they were ok.
● How does it help you answer your question? - I have been told to analyse the last 4 quarters for answers to the question.
● Are there any problems with the data? - Do not know yet ?
Sorting the Data
After doing a basic check of the CSV files in Excel i modified/renamed all the columns to make them consistent with Q1_2020.csv file as this will be the supposed going-forward table design for Divvy. While the names don't have to be in the same order, they DO need to match perfectly before we can use a command to join them into one file.

PROCESS:
● What tools are you choosing and why? - I will be using 'R'
● Have you ensured your data’s integrity? - So far OK
● What steps have you taken to ensure that your data is clean? - I will do all in 'R'
● How can you verify that your data is clean and ready to analyse? By checking Data
● Have you documented your cleaning process so you can review and share those results? - Am doing as i go.
Processing the datasets with R
I had to use RConsole as RStudio kept on crashing when i tried to merge all the datasets into one. The final dataset has approx. 3 million rows ! so first i had to load tidyverse, lubridate and ggplot.
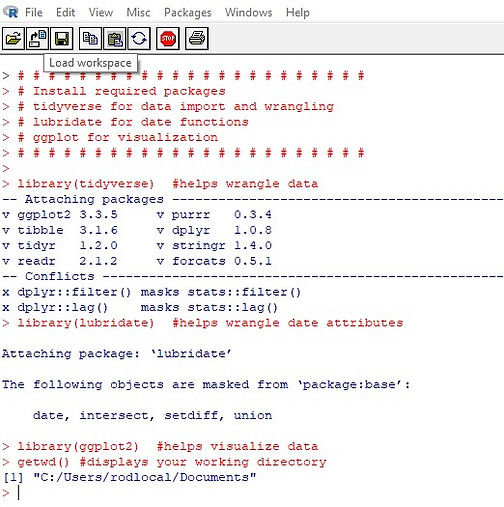
Then i had to merge the 4 csv files into 4 workable datasets.

Then perform basic checks in R. I done all the column work in excel.

I had to change the properties of some columns number to character and character to number etc.
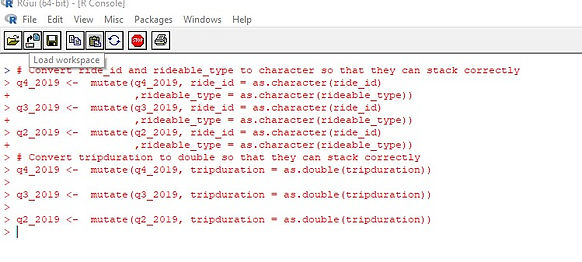
Then merge all 4 datasets into one dataset (all_trips) and do some quick checks.
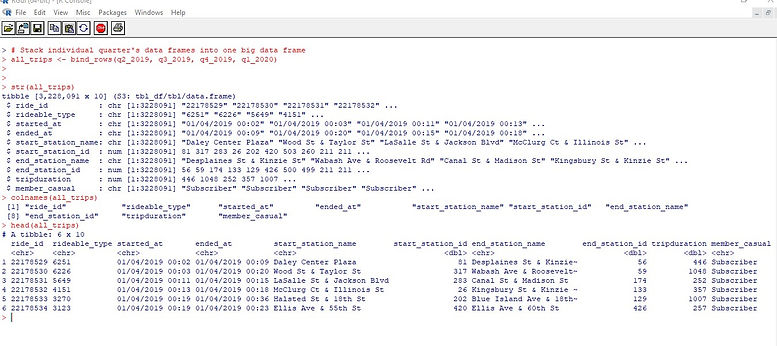
More checks.......
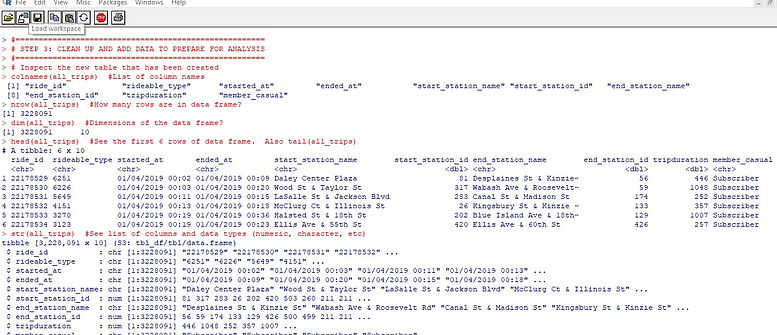

In the "member_casual" column, there are two names for members ("member" and "Subscriber") and two names for casual riders ("Customer" and "casual"). We will need to consolidate that from four to two labels.
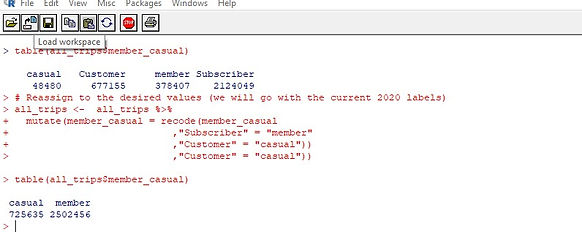
The data can only be aggregated at the ride-level, which is too granular. We will want to add some additional columns of data -- such as day, month, year -- that provide additional opportunities to aggregate the data.

We had to add a new column ride_length with a calculation of different trip times. Then we had to convert this column from character to a numeric column so we could run calculations on the data and finally remove bad data.

If you look at the above image in the (all_trips) dataset there were 584 bad entries that were below 0. When we created the new dataset (all_trips_v2) we removed all these bad entries leaving 3223740 good entries.

The above is a brief summary of the new dataset (all_trips_v2). We are also showing some numbers from the original dataset (all_trips) before removing bad data.
ANALYSE:
● How should you organise your data to perform analysis on it? - Completed this under Process.
● Has your data been properly formatted? - Yes.
● What surprises did you discover in the data? - 584 rows of bad entries.
● What trends or relationships did you find in the data? - Going to find that out now.
● How will these insights help answer your business questions? - Should give me a clear direction.
Below is a quick summary by doing calculations on column ride length. All numbers are in seconds (divide by 60 for minutes and divide the minutes again by 60 for hours).

All rides are broken down by member casual daily, i.e. casual Friday is the average ride time for all Friday's in the year by casual riders

All rides are broken down by member or casual, what day, total number of rides on that day over the year and the average duration of all the rides on that day.

Just having a quick look at the 3 images above it looks like the casual riders ride for a lot longer than the members but the members take more bike rides daily.......we will see !!
SHARE:
● Were you able to answer the question of how annual members and casual riders use Divvy bikes differently? - Yes
● What story does your data tell? - Casual riders ride longer whereas Members take shorter rides but more of them.
● How do your findings relate to your original question? - There is a direct correlation.
● Who is your audience? What is the best way to communicate with them? - Divvy VP's & stakeholders. A good presentation.
● Can data visualisation help you share your findings? - Most definitely
● Is your presentation accessible to your audience? - Yes.
After doing a visualisation in GGPLOT, for the highest number of rides over the year by weekday, the highest number is done by members. Members take more rides.

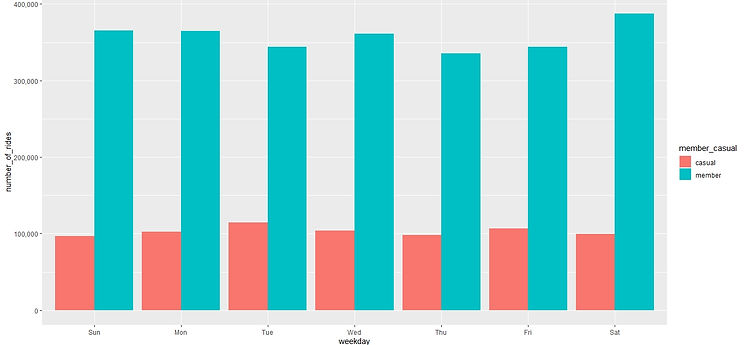
After doing a visualisation in GGPLOT, for the average duration of rides over a year by weekday, the highest number is done by casual riders. Casual riders take longer rides.


=================================================
STEP 5: EXPORT SUMMARY FILE FOR FURTHER ANALYSIS
=================================================
Create a csv file that we will visualize in Excel or Tableau.


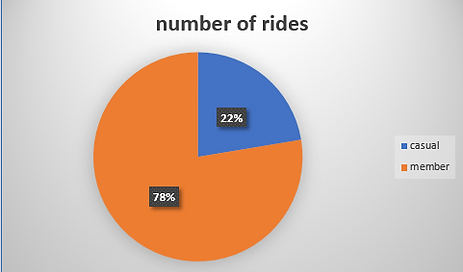
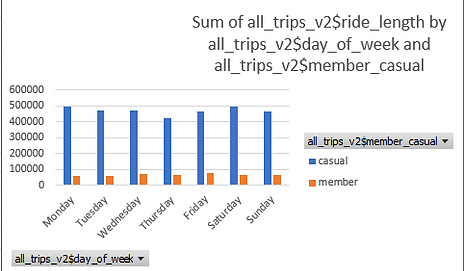
Some visualisations done in Excel that seem to back up the above visualisations. Members take more rides but Casual riders take longer trips or ride for longer.

ACT:
● What is your final conclusion based on your analysis? - Members take more rides, Casual riders ride longer.
● How could your team and business apply your insights? - Review membership options
● What next steps would you or your stakeholders take based on your findings? - Look at membership options at point of sale.
● Is there additional data you could use to expand on your findings? - Could do a UX usability study
Conclusion
What ways do members and casual riders use Divvy bikes differently?
Members take a lot more rides but casual riders ride for longer.
This could be because the members are commuting to work so the rides will be a shorter fixed duration and the casual riders are taking longer leisurely rides but the ride length for casual riders is consistent through all days of the week, you would think that you would see an increase at the weekend. Definitely more investigation of casual riders needed.
Why would Casual Riders want use Divvy more?
From the data it is quite clear that casual riders like Divvy because of their ride length which is much higher than members. For casual riders to use Divvy more they need better incentives on membership.
How can Divvy influence Casual Riders to become Members?
There has to be more membership types and incentives for example, a casual rider pays $15 for a days hire, at the point of sale he should be offered a weekly membership for an extra $5, maybe if a casual rider takes X amount of rides within the year lets say 10 he automatically gets an annual membership. Maybe being a Divvy annual member entitles you to discount coupons at shops. This whole membership thing has to be seriously brainstormed.
Going forward
Takeaways
Impact
While i feel that the analysis has answered the questions i don't think the data is comprehensive enough. There needs to be more research into casual users. As a UX researcher we say that historical data is only part of the research. There is no information as to whether rides are being booked through an app or is there just a credit card swipe at the bike. If they are using an app we could target casual users through this with a System Usability Scale(SUS) 10 question survey and if they complete it they get a free ride etc. to gather more information on casual riders.
What I learned
I learned a lot about R and how it is used in large datasets for statistical analysis and visualisations.
Next steps
1. Membership options
Need to be thoroughly investigated .
2. Casual user research
Conduct more research on the casual riders to determine more insights.
3. Conduct a SUS survey
Conduct SUS survey on the casual riders through the app to determine more insights.